See what's working. Down to the item, out to your BI.
Measure Performance turns your delivery data into clear, live reports. Progress, cycle time, throughput, and flow across teams, workstreams, and initiatives, with drill-through to the items behind each chart.
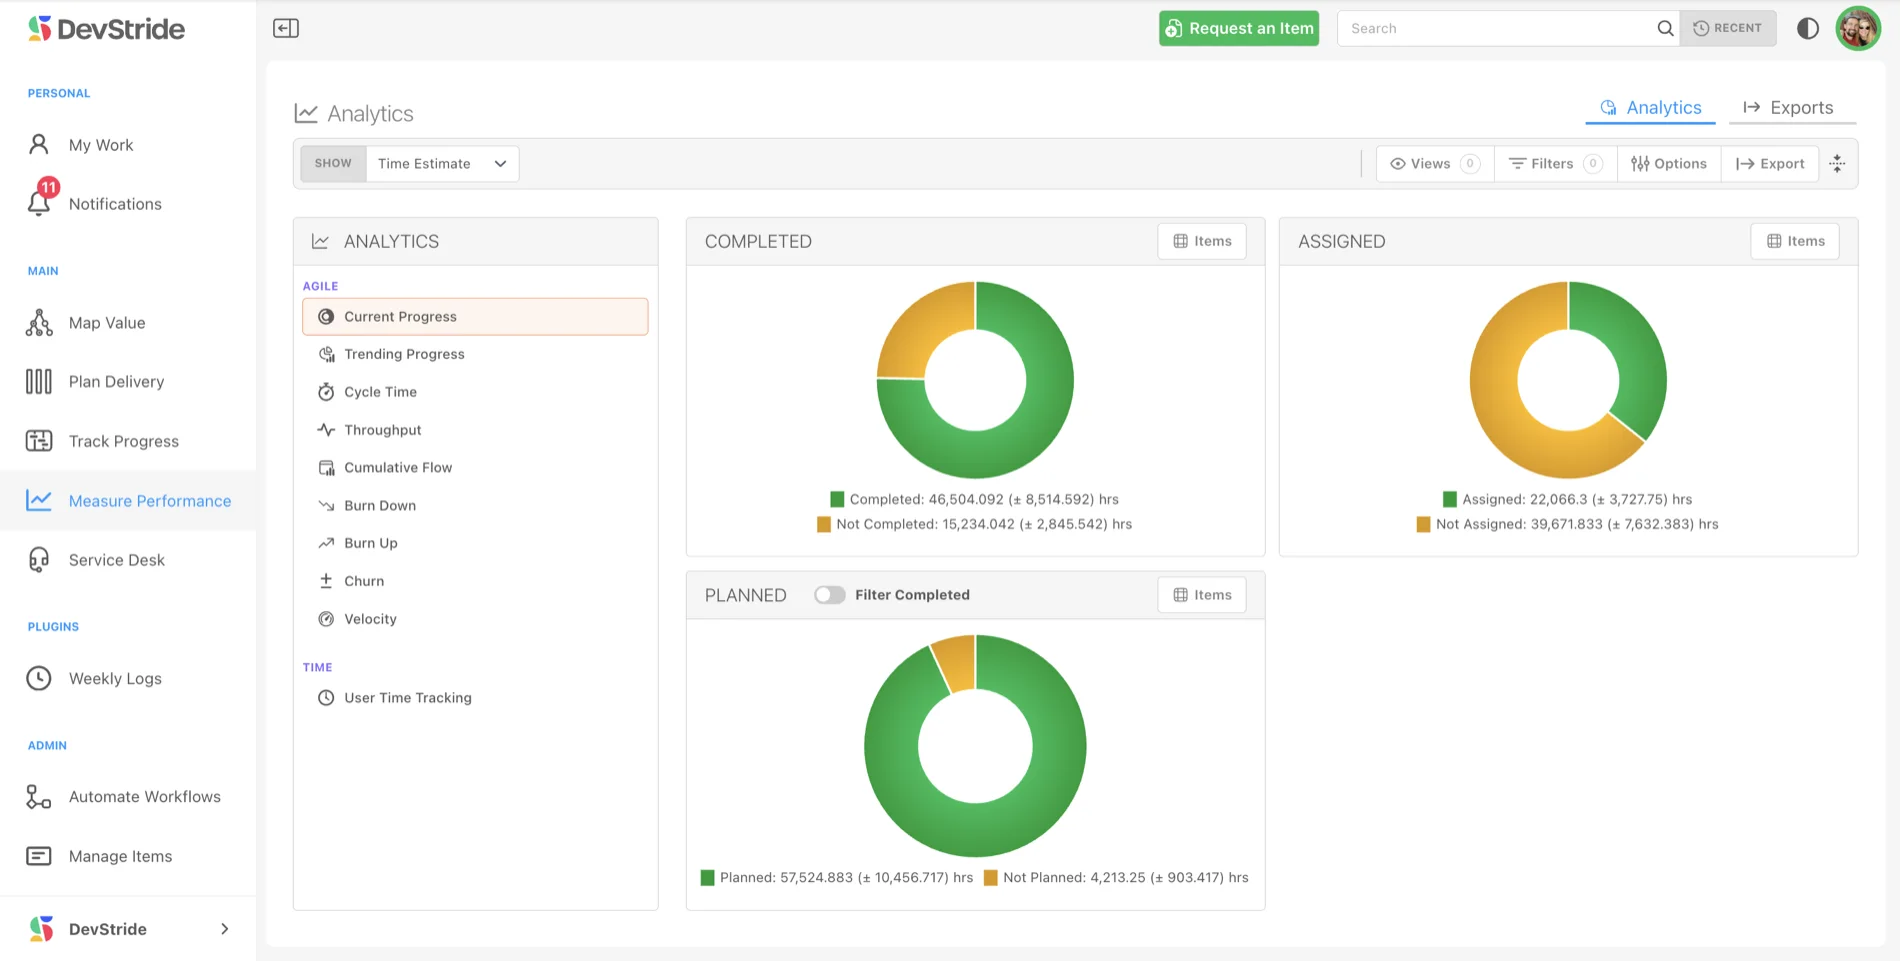
Roll-ups included, not an upsell.
Reports roll up across teams, workstreams, and strategic initiatives, so an executive and a team lead read the same numbers at different altitudes. No separate portfolio tier, no add-on module.
- Scope any report by date range or by timeboxes like sprints
- Switch the measure between count, time estimate, point estimate, and time spent
- Drill into the items behind any data point
- Export to Excel or share the result
Your DevStride data in Tableau, Power BI, or Metabase this afternoon.
Generate read-only PostgreSQL credentials and point Metabase, Tableau, Power BI, or any SQL client at your DevStride data. Connections go to a read replica rather than the live primary, so your dashboards and production stay out of each other's way.
- Read-only access, limited to SELECT
- Row-level security keeps queries scoped to your organization
- One copyable connection string, or individual fields for tools that want them
- Rotate, revoke, or delete credentials whenever you choose
A different lens for each question.
Are we on track? Where are the bottlenecks? How fast are we delivering? Each report answers one of the questions leaders actually ask, with drill-through to the items behind every chart.
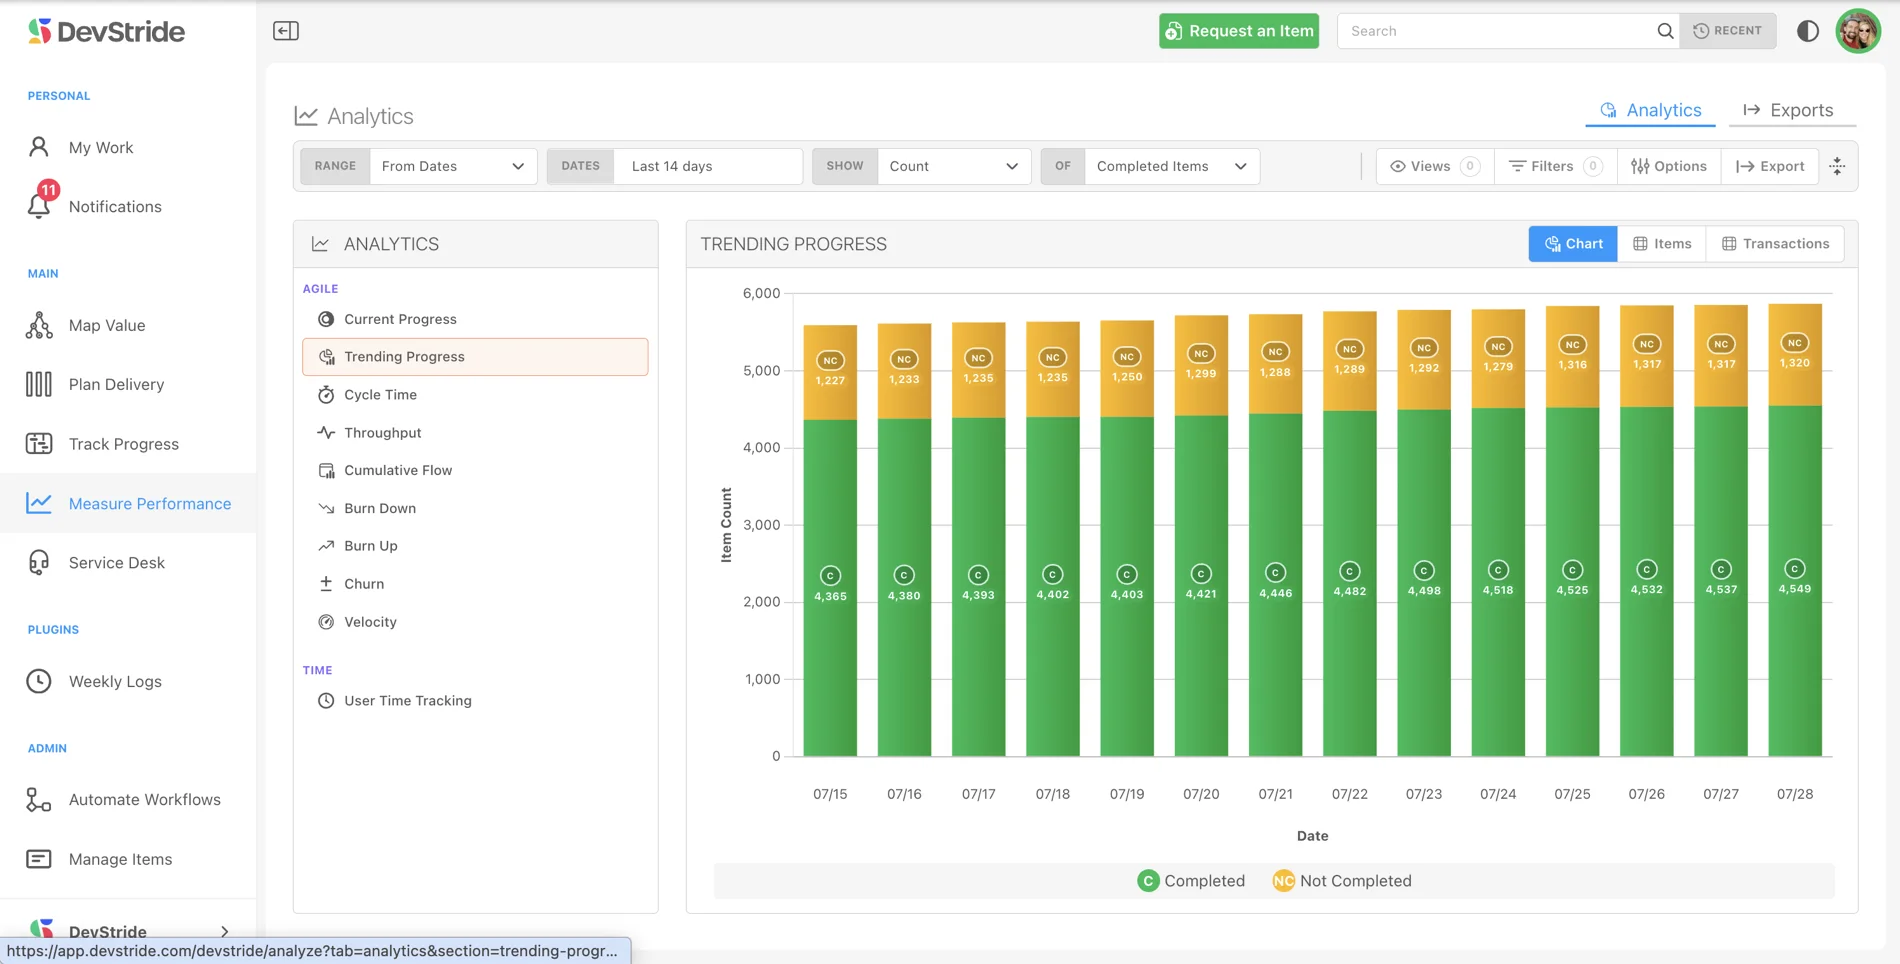
Current and trending progress
See how much work is done, in progress, or not started at any level, then watch how that picture changes over time.
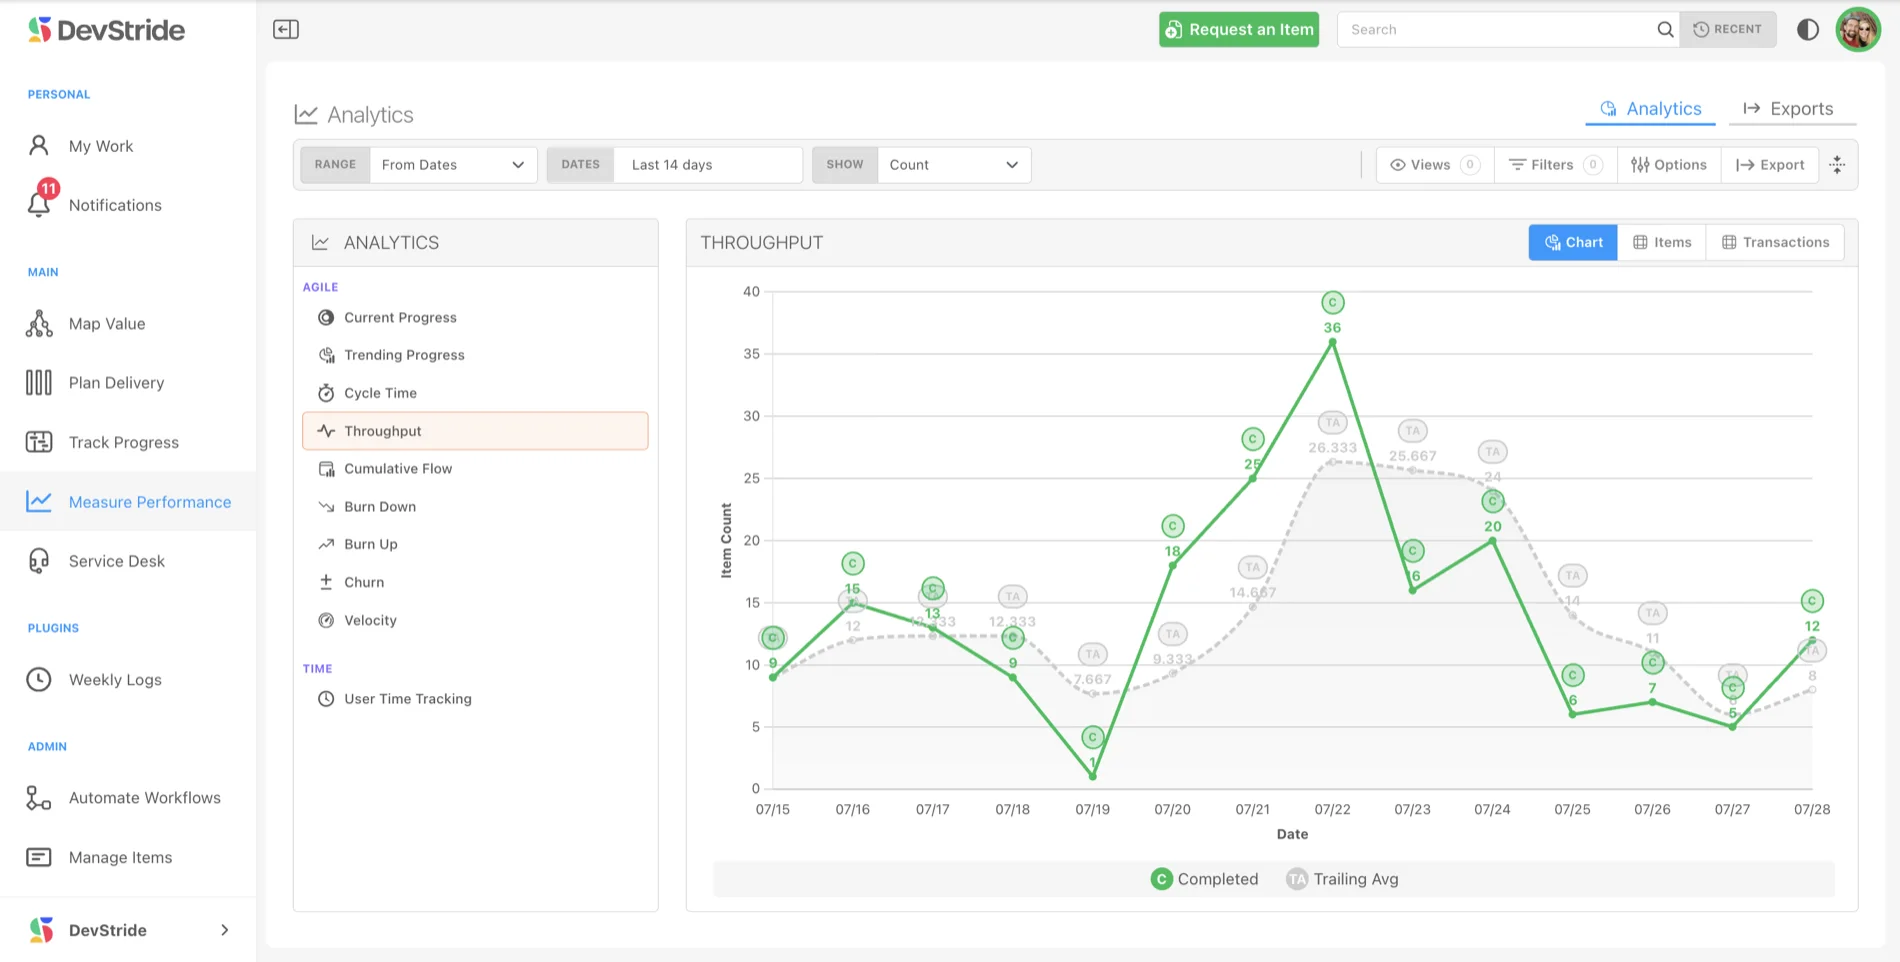
Throughput
How much work is getting done per period, with a trailing average that follows your delivery trend. Reopened items are netted out so the totals stay honest.
Cycle time
How long work takes from start to finish. A scatter plot puts one point on the chart per completed item, so outliers and patterns stand out instead of hiding behind an average.
Cumulative flow
Watch work move through each stage of your workflow over time and detect bottlenecks as they form.
Velocity and churn
Measure what each team completes per cycle in points, count, or time, and see how much work was added or removed mid-cycle.
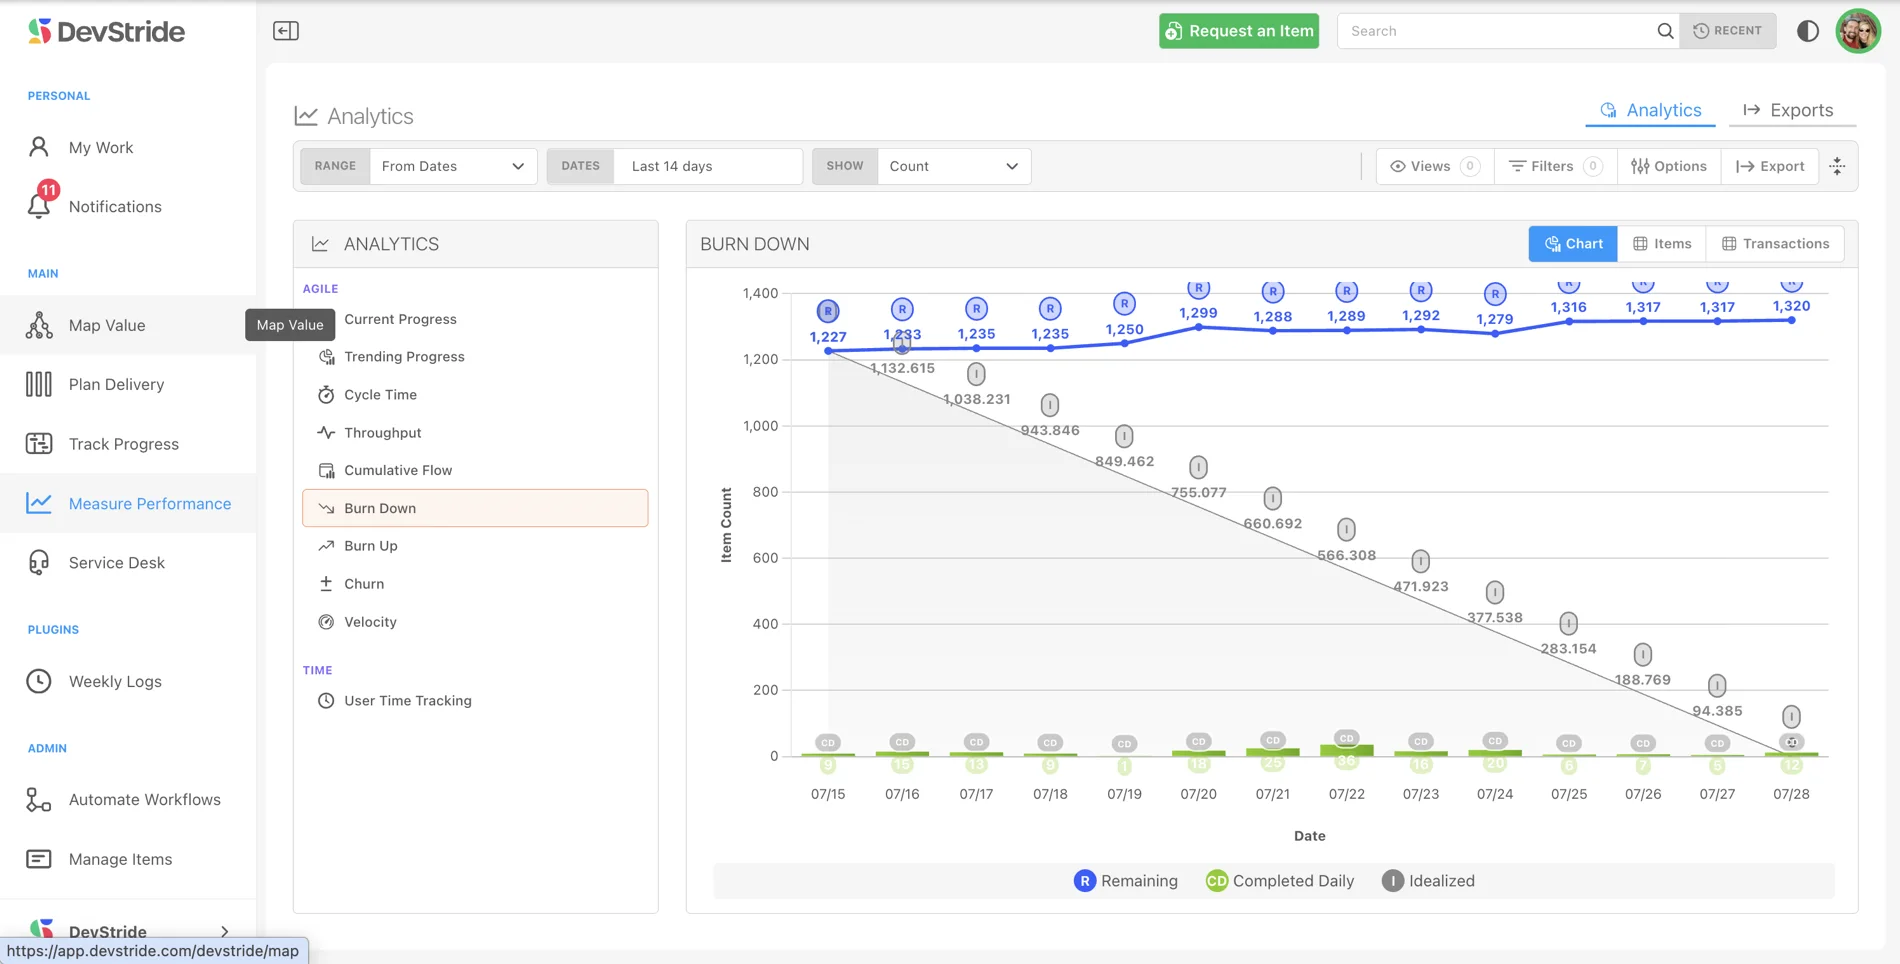
Burn up and burn down
Track completed work against total scope, or remaining work against a deadline, with a projected line that extends your current pace forward.
AI that reads the report with you.
Open any report and write a prompt, like asking what a teammate worked on in June. The built-in assistant infers the filters from your question and surfaces a report that answers it. Prefer to ask from outside DevStride? The MCP Server lets assistants like Claude query your workspace data too.
- Prompts run against your report data, not a generic model guess
- Edit the filters and re-run to refine the answer
- Drill in, export, or share what it finds
Part of one connected system.
Measure Performance reads the same live work items the rest of DevStride runs on, so the numbers match what the teams are actually doing.